Position Sizing and Risk per Trade: How to Protect Your Trading Capital and Grow Accounts
Categories Risk Management
In trading, “Risk per Trade” and “Position Sizing” are linked concepts.
Risk per Trade (RpT) is the strategic, portfolio-level decision. It is a predetermined percentage of total trading capital that a trader is willing to lose on any single trade. For example, a trader with a $25,000 account and a 2% RpT rule has strategically decided the maximum acceptable loss per trade is $500.
Position Sizing (PS) is the tactical, trade-level calculation. It is the mechanical process of determining the quantity of an asset to trade (e.g., number of shares or lots) to ensure that if the trade is stopped out, the resulting loss equals the predefined Risk per Trade.
The 1-2% Rule: The Industry Standard for Longevity
The 1-2% Rule is a cornerstone of risk management, stating that a trader should never risk more than 1% to 2% of their total available trading capital on any single trade. On a $10,000 account, this limits the maximum potential loss to $100 (at 1%) or $200 (at 2%).
Adherence to this rule:
● Prevents catastrophic single-trade losses.
● Preserves capital during inevitable losing streaks.
● Encourages trade selectivity and discipline.
● Reduces stress by pre-quantifying and accepting a manageable loss.
The Mathematical Asymmetry of Drawdowns
The 1-2% rule’s primary function is to manage the non-linear effects of drawdowns. The relationship between a capital loss and the subsequent gain required to recover is asymmetrical.
A 50% loss on a $10,000 account leaves $5,000. To recover to the $10,000 break-even point, the $5,000 account must achieve a 100% gain. The 1-2% rule is a drawdown management strategy designed to keep the account in the “shallow” end of this recovery curve, where losses are mathematically trivial to recover.
Key Table: The Asymmetry of Loss and Recovery
| Account Drawdown (Loss) | Gain Required to Break Even |
| -10% | +11.1% |
| -20% | +25.0% |
| -30% | +42.9% |
| -50% | +100.0% |
| -75% | +300.0% |
This data proves that a trader’s primary job is to aggressively protect their capital.
The Universal Position Sizing Formula: A Step-by-Step Guide
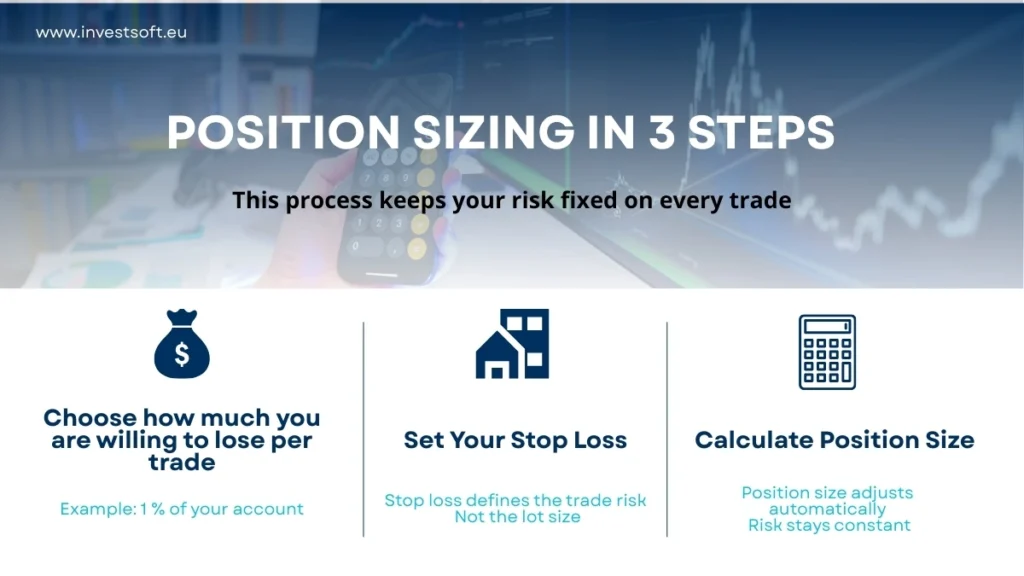
The Three-Step Universal Formula
The calculation for position sizing is a universal, three-step formula.
Step 1: Determine Account Risk (AR)
This is the maximum dollar amount to risk, derived from the strategic 1-2% rule.
- Formula: AR ($) = Total Account Equity x Risk %
- Example: $25,000 Account x 2% Risk = $500 AR.
Step 2: Determine Trade Risk (TR)
This is the per-unit risk: the difference between the entry price and the stop-loss price.
- Formula (Long): TR ($/unit) = Entry Price – Stop-Loss Price
- Example: Buy at $50, stop-loss at $48. The Trade Risk is $2 per share.
Step 3: Calculate Position Size (PS)
This is the final calculation, determining the number of units to trade.
- Formula: PS (units) = AR ($) / TR ($/unit)
- Example: PS = $500 (AR) / $2 (TR) = 250 shares.
Practical Application: Calculating Stock Position Size
Here is a practical example for a stock trade:
- Account Equity: $25,000
- Risk per Trade: 2% (This is your $500 Account Risk)
- Planned Entry Price: $225
- Logical Stop-Loss Price: $195
- Trade Risk (TR): $225 (Entry) – $195 (Stop) = $30 per share
Position Size Calculation:
- PS = $500 (AR) / $30 (TR) = 16.67 shares
Conclusion: The correct position size is 16 shares (rounding down). The total risk is 16 shares x $30/share risk = $480, which is within the $500 limit.
How Traders Apply Position Sizing in MetaTrader 5 in Practice
MetaTrader 5 does not calculate position size or risk per trade automatically.
In practice, this means that traders need to manually convert stop loss distance into monetary risk and then calculate the correct lot size for every single trade.
This process becomes even more complex when trading different instruments such as Forex pairs, gold, or indices, where pip values and contract specifications vary significantly.
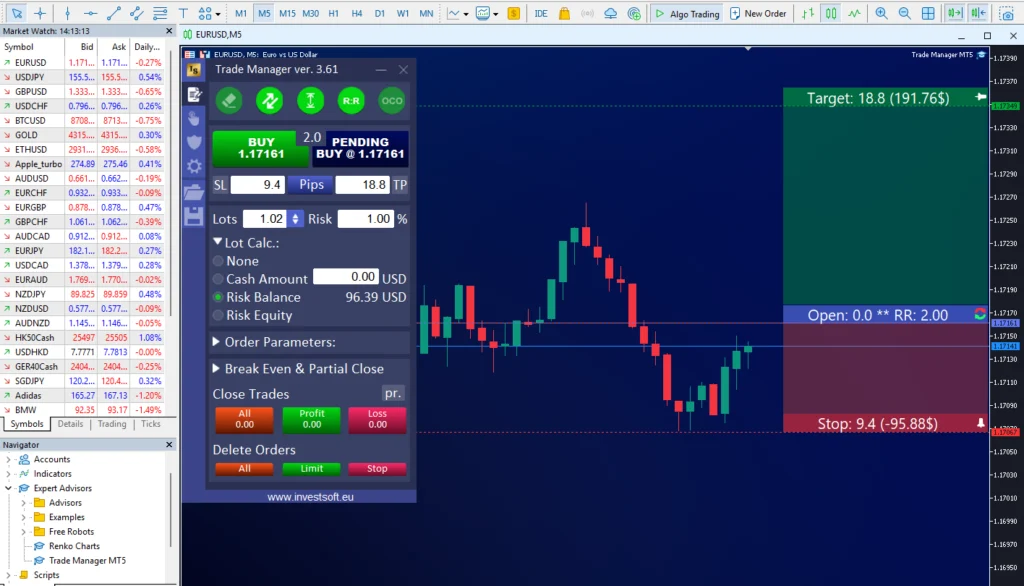
Because of this, many traders rely on dedicated tools that automate position sizing directly on the chart. A good example is Trade Manager for MT4 and MT5, which allows traders to define their risk per trade first and then calculates the correct position size automatically once the stop loss is placed.
Instead of recalculating everything manually, the trader can focus on execution and trade management while the risk remains fully controlled.
Practical Example Using Position Sizing on a Real Trade
Consider a trader with a 25,000 USD trading account who risks 1 percent per trade.
After identifying an entry on EURUSD and placing a stop loss on the chart, the total distance to the stop equals 48 pips. Based on this distance, the correct position size must be calculated so that the maximum loss does not exceed 250 USD.
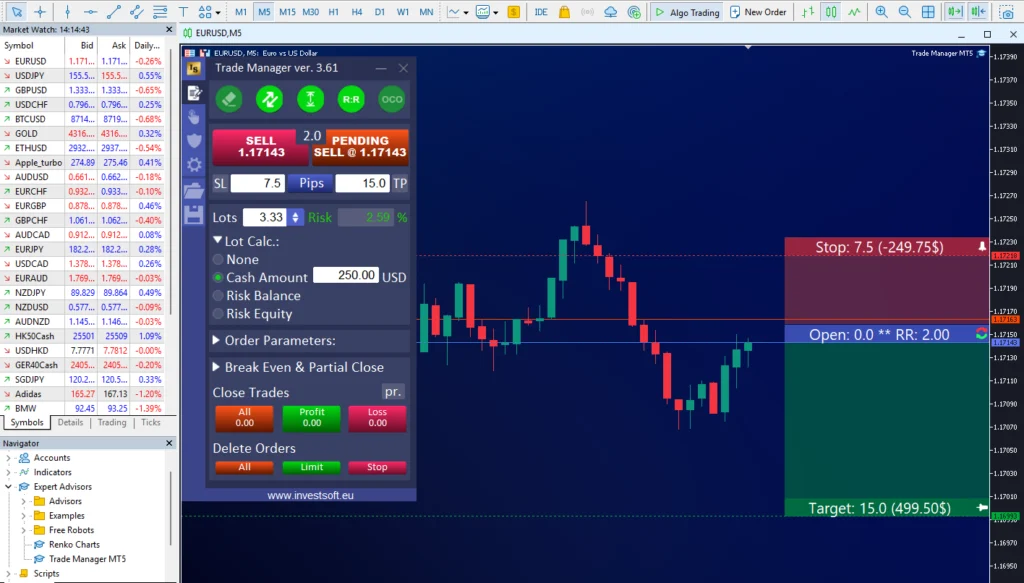
Using a position sizing tool inside MetaTrader, the trader can immediately see the correct lot size calculated in real time. If the stop loss is adjusted, the position size updates automatically, ensuring that the predefined risk per trade is always respected.
This approach removes guesswork and eliminates calculation errors that often occur when position sizing is done manually.
Short video walkthrough: the fastest way to calculate lot size in MT5
There are several ways to calculate position size in trading. You can do it manually with a calculator, use a spreadsheet, rely on a simple indicator, or use an external position size calculator outside the platform. The issue is that most methods are slow, easy to misread, or prone to mistakes when you change the stop loss distance, switch symbols, or trade different contract specifications. The only approach that consistently combines speed and reliability is on chart lot size calculation, where position size updates instantly as you move entry and stop loss levels. Watch the short video below to compare the common methods and see which workflow eliminates errors and keeps your risk per trade consistent.
A Comparative Analysis of Position Sizing Methodologies
Traders may encounter several methodologies.
Model 1: Fixed Percentage (Fixed Fractional)
Risks a fixed percentage (e.g., 1%) of account equity. Its main advantage is that it scales with the account (1% of $10k is $100; 1% of $20k is $200), allowing natural compounding. Its main weakness is that it ignores volatility.
Model 2: Fixed Dollar Amount
Risks a fixed dollar amount (e.g., $100) per trade. Its fatal flaw is that it does not scale. If an account shrinks from $10,000 to $5,000, the $100 risk doubles from 1% to a more dangerous 2%.
Model 3: Volatility-Based (ATR) Sizing
An advanced model that normalizes risk by adapting to current market volatility. It uses the Average True Range (ATR) indicator to set a dynamic stop-loss (e.g., 2 x ATR) based on market “noise”. The formula PS (units) = AR ($) / (ATR x ATR Multiple) automatically reduces position size in high-volatility markets.
Model 4: Kelly Criterion
A complex formula to find the theoretically optimal risk percentage to maximize long-term growth. It is practically untenable for most, as a slight overestimation of one’s win rate can suggest dangerously high risk (e.g., 20-40%). Professionals use a “Fractional Kelly” to be more conservative.
Key Table: Comparative Analysis of Position Sizing Models
| Model | Core Principle | Pros | Cons | Ideal User |
|---|---|---|---|---|
| Fixed Percentage | Risk a constant % of equity (e.g., 1%) per trade. | Simple, robust capital preservation, scales with account. | Ignores market volatility, can be inefficient. | Beginner to Intermediate |
| Fixed Dollar | Risk a constant $ amount (e.g., $100) per trade. | Extremely simple, predictable dollar loss. | Does not scale with account; risk % fluctuates dangerously. | Beginner (on a static account) |
| Volatility-Based (ATR) | Risk is normalized based on the asset’s current volatility (ATR). | Adapts to market conditions, provides logical stop-loss. | More complex to calculate. | Intermediate to Advanced |
| Kelly Criterion | Mathematically optimal sizing based on historical performance. | Maximizes long-term growth (in theory). | Extremely aggressive, high-risk, volatile drawdowns. | Advanced/Quantitative |
Strategy, Expectancy, and Psychology
Sizing as the Antidote to Fear and Greed
A mathematical sizing plan manages the emotions that destroy traders.
Greed is the impulse to oversize a “high-conviction” trade; a 1% rule is a mechanical shield against this.
Fear is the psychological response to oversized risk. A proper position size passes the “Sleep Test”: if you can’t sleep, your position is too large. By pre-accepting a small, 1% loss, fear is eliminated.
Breaking the Psychological Boom-Bust Cycle
Inconsistent sizing creates a “Boom-Bust Cycle.” A trader gets overconfident (Greed), oversizes a trade, and takes a magnified loss. This creates Fear, leading them to undersize the next trade, which is a small, frustrating win. This frustration leads back to Greed. A consistent, non-discretionary sizing model breaks this cycle at its root.
The “Expectancy Triangle”: WR, RRR, and RpT
A strategy is only viable if it has a Positive Expectancy—it is mathematically expected to make money over time. This depends on the relationship between Win Rate (WR) and Risk/Reward Ratio (RRR).
Expectancy = (Win % x Average Win) – (Loss % x Average Loss)
Profitability does not require a high win rate. A strategy with a 40% Win Rate is highly profitable if it maintains a 1:3 RRR.
- Out of 100 trades (risking $100):
- 60 losses x -$100 = -$6,000
- 40 wins x +$300 = +$12,000
- Net Profit: +$6,000
Common Capital-Destroying Pitfalls
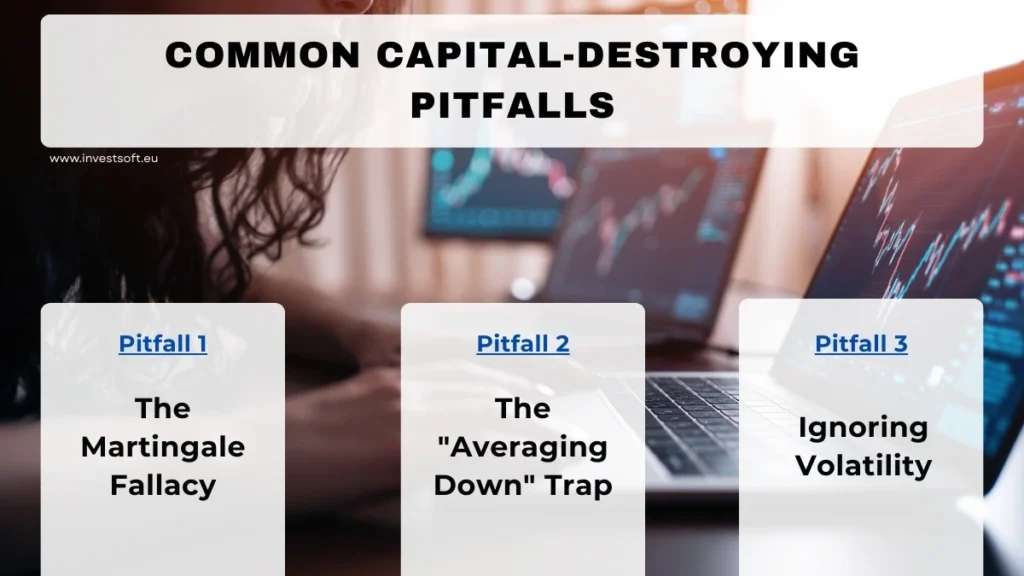
Lets go through some common capital destroyers traders may have to face:
- Pitfall 1: The Martingale Fallacy: The practice of doubling the position size after every consecutive loss. This is a mathematically-doomed strategy that guarantees 100% “Risk of Ruin” because it assumes infinite capital.
- Pitfall 2: The “Averaging Down” Trap: This is the emotional response of adding to a losing position. It violates the primary maxim of “Cut your losers” by increasing risk as a trade proves itself to be wrong. This is not to be confused with “Scaling In,” which is a planned entry strategy.
- Pitfall 3: Ignoring Volatility: This is applying the 1% rule but failing to adjust the stop-loss distance for market volatility. A stop-loss that is too tight for a volatile market will be repeatedly triggered by normal market noise rather than a true change in direction.
Making Position Sizing Simple and Error Free
Position sizing should be mechanical, not emotional.
Manually calculating risk for every trade increases the chance of errors and slows down execution.
By using a dedicated position size calculator for MT4 and MT5, traders can automate risk management directly on the chart, see risk and reward instantly, and execute trades with confidence.
Learn more about Trade Manager for MetaTrader 4 and 5 here:
https://www.investsoft.eu/forex-trade-manager-position-size-calculator.html
Conclusion: From Capital Protection to Compounding Growth
Position sizing is the mechanical bridge that connects a trading strategy to long-term compounded growth. The 1-2% rule begins as a defensive tool for capital protection, but it is also an offensive tool for compounding. The Fixed Percentage model has this scaling mechanism built in.
- On a $10,000 account, a 1% risk is $100.
- When the account reaches $20,000, the 1% risk automatically scales to $200.
This allows geometric returns without increasing the relative risk.
Traders who “blow up” their accounts do not fail because they are “wrong” about market direction. They fail because they are sized wrong. Mastery of risk is achieved through a mathematical and consistent position sizing methodology. It is the only mechanism that tames emotion, manages drawdowns, and ultimately unlocks the power of compounding.