Trading Drawdown and Losing Streaks: How Much Risk per Trade Can Your Account Survive?
Categories Risk Management
You can have a strategy with a real, tested edge. You can size every position "sensibly." And you can still open your terminal one week and find five, six, even ten losing trades sitting in a row on your statement. That’s not a sign something is broken. It’s what trading actually looks like, sooner or later, for almost everyone who does it long enough.
The question worth asking isn’t "can I lose five trades in a row?" You can, and over a long enough trading history, a run of losses is entirely plausible. The question that actually matters is: what happens to my account when I do?
That’s what this article is about. Risk per trade is usually taught as a single-trade decision: how much you’re willing to lose if this one position goes wrong. It’s also something bigger than that. It’s the multiplier sitting underneath every losing streak your strategy will ever produce, quietly deciding whether that streak is a rough week or a wipeout. A positive-expectancy strategy can still hand you a real, painful drawdown. Risk per trade is what decides how deep that drawdown goes, and whether your account is still standing on the other side of it.
What Is Drawdown in Trading?
Drawdown is simply the decline from a previous equity peak to whatever your account is worth now. If your account grows to $12,000 and then slides back to $10,800, you’re in a 10% drawdown from that peak, regardless of how you got there.
Expressed as a percentage, drawdown is the loss divided by the peak balance it fell from. A $1,000 loss on a $10,000 peak is a 10% drawdown. A $1,000 loss on a $20,000 peak is only 5%. The dollar figure alone tells you very little; the percentage relative to your peak is what actually describes the damage.
Maximum drawdown is just the worst of these declines across your whole track record, the deepest hole you’ve ever been in, peak to trough. It’s the number worth watching most closely, because it’s usually the closest thing you have to a real-world stress test of your own risk management.
One more distinction worth a moment: drawdown can be floating or realized. A losing position that’s still open is a floating (unrealized) drawdown. It can recover without you doing anything, simply because price moves back in your favor. Once you close a losing trade, that specific loss is locked in and realized. It’s no longer at the mercy of the market changing its mind, though your account’s overall drawdown can still recover through future trades. The two feel very different while you’re sitting in them, but for the purposes of this article, it’s the realized, closed-out percentage that matters, because that’s the number the math below actually works on.
Why Losing Streaks Happen Even With a Good Strategy
One thing to drop immediately: a 50% win rate does not mean your trades alternate, win-loss-win-loss, like clockwork. Wins and losses cluster. That’s not bad luck or a flaw in your system. It’s just what a sequence of independent outcomes actually looks like when you plot it out. Long strings of one result and long strings of the other are a completely normal feature of any strategy with real variance in it, not evidence that something has gone wrong.
This holds even for strategies with a strong win rate. A 60% or 70% win rate still means you’re losing 40% or 30% of the time, and those losses don’t spread themselves out evenly across your trade history. They bunch up. A trader running a genuinely solid 65%-win-rate system can still open five losers in a row purely from the ordinary rhythm of that win rate, not because the edge has disappeared.
A lot of traders get the logic backwards here. Positive expectancy tells you what happens on average, over a large number of trades. It says nothing about the order those wins and losses arrive in, and it doesn’t promise that any particular short stretch of trades (ten, twenty, even fifty) will look anything like the long-run average. A strategy can be completely sound and still deliver a rough month, simply because that’s one of the many sequences a sound strategy is capable of producing.
What it does not mean is that you can predict, from a win rate alone, exactly how long your next losing streak will be. There’s no honest version of "at a 60% win rate you’ll get exactly four losses in a row". Real streaks are a matter of probability, not a fixed schedule. We’ll come back to what can and can’t be said about streak probability a little further down.
How Risk per Trade Turns a Losing Streak Into Drawdown
This is where risk per trade stops being a single-trade decision and starts being an account-level one.
If you risk a fixed percentage of your account on every trade (the standard approach, and the one this article assumes throughout), then each loss is taken as a percentage of whatever capital is left after the previous loss, not a percentage of your original starting balance. That distinction matters more than it sounds like it should.
The exact relationship is:
Remaining Capital = Starting Capital × (1 − Risk%)^N
Drawdown% = 1 − (1 − Risk%)^N
where N is the number of consecutive losses.
Because each loss eats into an already-smaller balance, the losses compound rather than simply adding up. That distinction matters: the shortcut version (just multiplying risk per trade by the number of losses) is close enough at low risk levels, but it increasingly overstates the compounded drawdown under fixed-fractional sizing as risk per trade rises. Risk 5% per trade and hit five losses in a row, and simple multiplication tells you you’re down 25%. Run the actual compounding formula and the real number is 22.62%, a touch better, because you’re losing a percentage of a shrinking pile each time, not a fixed slice of the original one. At 2% risk and ten losses, the naive multiplication says 20%; the real, compounded figure is 18.29%. The gap isn’t dramatic at these levels, but it grows the higher your risk per trade climbs. Know which number you’re actually looking at before you use it to decide how much risk you can stomach.
Here’s what that formula produces across a range of risk levels and losing-streak lengths:
| Risk per trade | 5 losses | 10 losses | 15 losses | 20 losses |
|---|---|---|---|---|
| 0.25% | 1.24% | 2.47% | 3.69% | 4.88% |
| 0.5% | 2.48% | 4.89% | 7.24% | 9.54% |
| 1% | 4.90% | 9.56% | 13.99% | 18.21% |
| 2% | 9.61% | 18.29% | 26.14% | 33.24% |
| 3% | 14.13% | 26.26% | 36.67% | 45.62% |
| 5% | 22.62% | 40.13% | 53.67% | 64.15% |
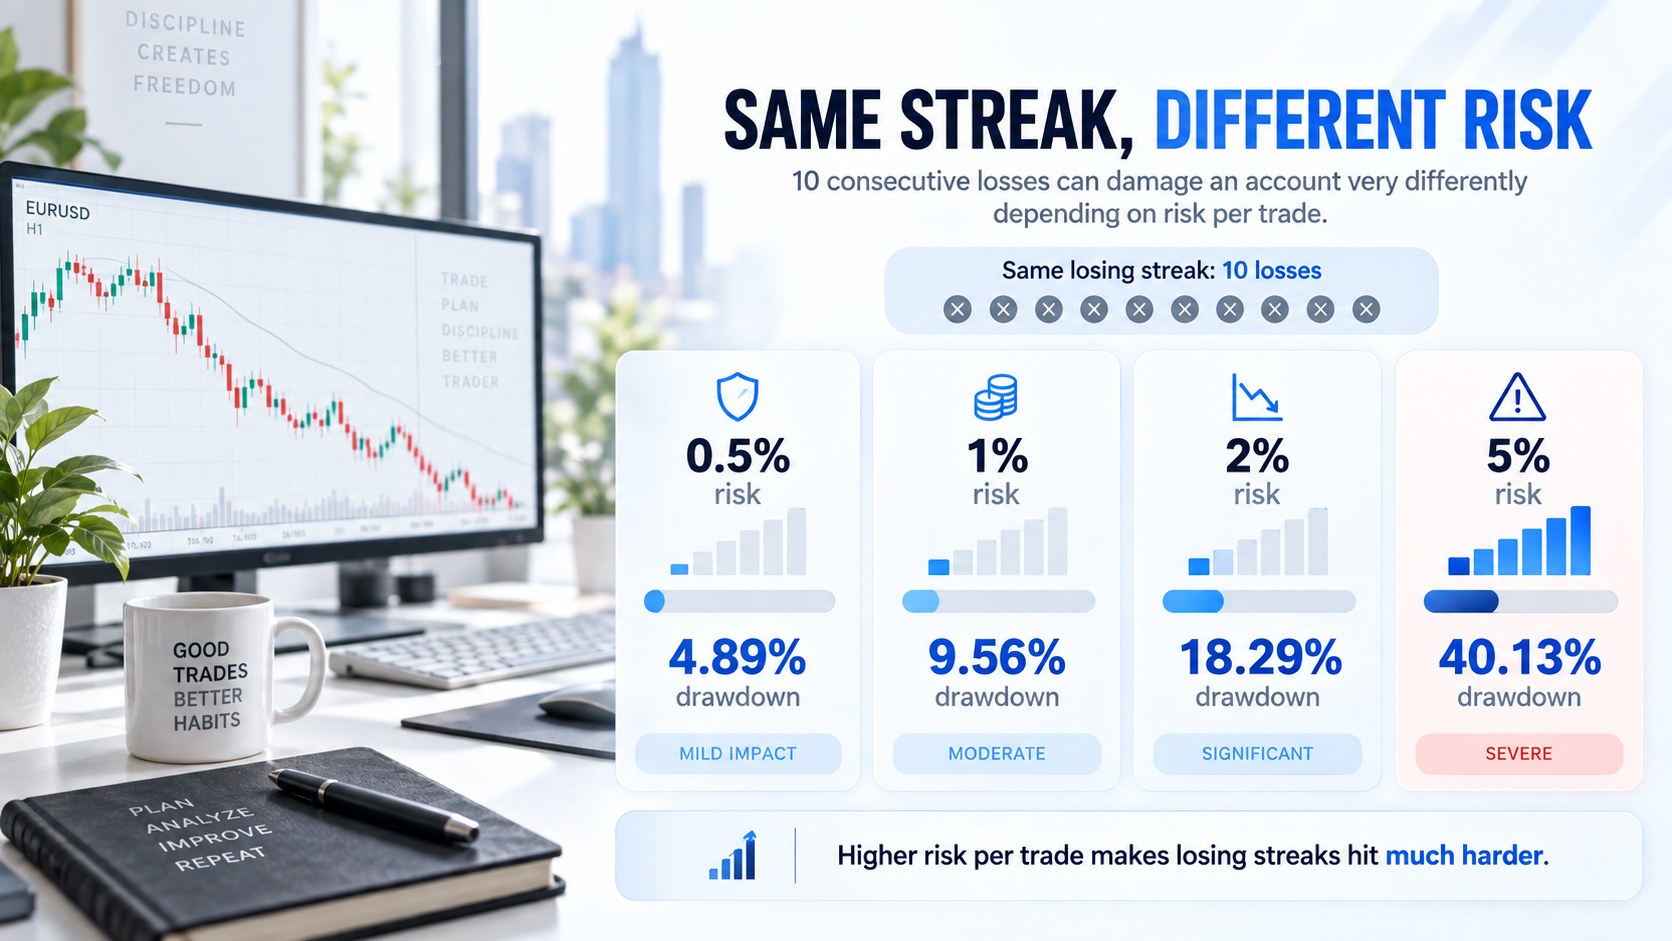
A couple of things stand out reading across this table. At 0.5% risk, even a bruising 20-loss streak leaves you under a 10% drawdown. That’s uncomfortable, but a level many personally-funded accounts could absorb, though what’s actually tolerable always depends on your own capital and constraints. At 5% risk, ten losses alone puts you down over 40%, and that’s before we even get to what it takes to climb back out. This table doesn’t assume anything unusual is happening to your strategy. It’s the same losing streak, run through different risk-per-trade settings, and the outcome is not remotely the same account.
One important caveat: this table assumes N consecutive full-stop losses, each one hitting the full risked amount. Real losing streaks are messier than that in practice: some trades will be breakeven, some partial losses, some might even be small winners tucked inside a rough stretch. Treat this table as a worst-case stress test, not a forecast of exactly what your next bad run will look like.
Why Drawdown Recovery Gets Harder
The part that catches a lot of traders off guard: recovering from a drawdown always takes a bigger percentage gain than the drawdown itself.
Required Recovery % = Drawdown ÷ (1 − Drawdown)
The reason is simple once you see it: the recovery gain has to be earned on a smaller capital base than the one you lost it from. Lose 10% of a $10,000 account and you’re trading with $9,000. Getting back to $10,000 from $9,000 isn’t a 10% gain, it’s an 11.1% gain. It’s the same dollar amount, but a bigger percentage, because the base you’re growing from has shrunk.
| Drawdown | Recovery required |
|---|---|
| 5% | 5.26% |
| 10% | 11.11% |
| 20% | 25.00% |
| 30% | 42.86% |
| 40% | 66.67% |
| 50% | 100.00% |
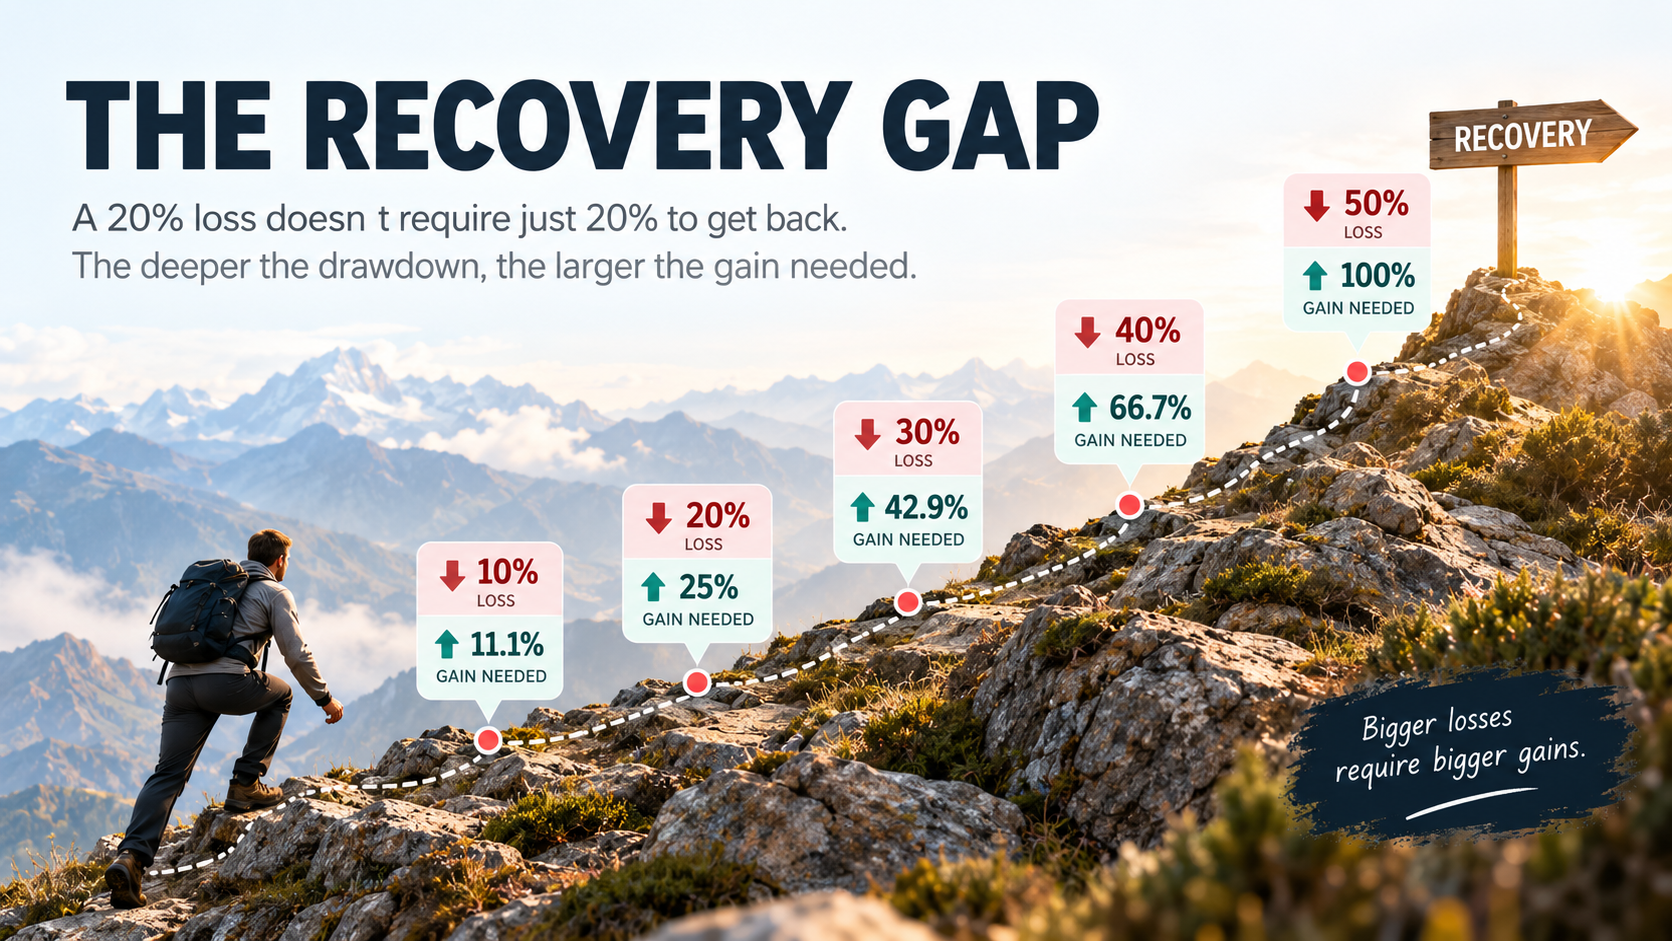
Look at how quickly that gap opens up. A 10% drawdown needs an 11% recovery. That’s barely noticeable. A 50% drawdown needs a full 100% recovery, meaning you have to double what’s left in your account just to get back to where you started. This is the asymmetry that makes deep drawdowns so much more dangerous than they first appear: the deeper the hole, the disproportionately harder the climb out.
Can You Predict Your Next Losing Streak From Win Rate?
Once you accept that losing streaks are normal, the next question is whether you can put a number on them. Here you have to be careful, because there are two different questions hiding inside "how likely is a losing streak," and they don’t have the same answer.
The first question: what’s the probability that a specific run of N trades, starting right now, are all losses? If q is your loss rate (1 minus your win rate), then:
P(N consecutive losses) = q^N
Take a coin-flip-simple 50% win rate. The probability that your next five trades in a row are all losers is 0.5⁵, which works out to about 3.1%. Push the win rate up to 70% (a 30% loss rate) and that same five-loss run drops to roughly 0.24%, a sharp fall, because each additional trade in the streak multiplies the probability down further.
That’s a real, useful number, but it only answers the narrow question it was built for: this specific run, starting now. It does not tell you how often you should expect to eventually see a streak that long somewhere across your next 100 or 500 trades. That’s a different question, with a different (and more involved) calculation behind it, and the two shouldn’t be treated as interchangeable. A small "probability of this exact streak" figure can feel reassuring in a way that’s misleading if you mistake it for "this basically never happens to me."
There’s also a set of assumptions baked into that formula, and they deserve to be stated plainly rather than glossed over: it assumes each trade’s outcome is independent of the last, and that your loss rate is stable and genuinely known. Real trading tests both of those assumptions constantly. Market regimes shift, and a strategy that performed one way in a trending market can behave very differently once conditions change, producing a cluster of related losses that isn’t really "random," even though it looks like one from the outside. Setups can be correlated with each other rather than independent. Execution quality drifts. And the win rate itself is only ever an estimate pulled from a limited sample of past trades, not a fixed, known constant handed down from above. Treat any streak-probability figure as a useful planning tool under stated assumptions, not a guarantee about what your account will actually experience.
What Risk of Ruin Really Means
At its core, risk of ruin is the probability that an adverse sequence of trades takes your account down to a point where continuing under your original plan is no longer realistic, whether that’s defined as losing the account entirely, or reaching some predefined capital floor below which the plan simply stops working. What drives that probability is an interacting set of variables: your win probability, your average winner versus your average loser, how much you risk per trade, and how much capital you’re working with in the first place. Change any one of those and the picture shifts.
"Risk of ruin" gets thrown around a lot in trading education, usually attached to one calculator or one formula presented as the answer. It’s more useful to understand the honest version of the concept than to recite the tidy one.
To be upfront: there isn’t one universal risk-of-ruin formula. Different models are built on different assumptions: some treat risk as a fixed percentage of your current balance, some assume a fixed dollar amount, some run a parametric calculation from your win rate and payoff ratio directly, others simulate thousands of possible trade sequences instead. These aren’t interchangeable, and that’s exactly why you can plug what looks like the same set of numbers into two different "risk of ruin calculators" online and get two different answers. Different outputs don’t by themselves prove that one calculator is wrong. The underlying models may simply be built on different assumptions about how your risk and your trades actually behave.
So this article isn’t going to hand you a single risk-of-ruin formula or a "safe" percentage threshold to aim for, because doing so would be presenting false precision as if it were settled fact. What can be said plainly: holding your strategy’s win rate and payoff ratio constant, increasing your risk per trade increases the damage an adverse sequence can do, and shrinks the margin you have left to absorb ordinary variance. This pattern appears across the approaches reviewed here, even though those approaches don’t agree with each other on exact risk-of-ruin values. That relationship is the one thing worth carrying out of this section: not a specific number, but a direction.
Positive Expectancy Does Not Mean a Smooth Equity Curve
Expectancy describes what your strategy does on average, across a large number of trades. It’s the number that tells you whether, over the long run, your winners outweigh your losers by enough to make the whole exercise worthwhile.
What expectancy does not describe is the order in which those wins and losses show up. A genuinely positive-expectancy system can hand you a losing month, a losing quarter, even a real, uncomfortable drawdown, purely as a function of variance and sequence, not because the edge has stopped working. The average is still positive; the path to that average is just rarely a straight line.
This is exactly why the risk-per-trade decision matters as much as the edge itself. Expectancy tells you the strategy is worth trading. Risk sizing is what determines whether you’re still in a position to keep trading it through the rough stretches that a positive edge is entirely capable of producing along the way. For a deeper look at how expectancy, win rate, and risk-to-reward actually interact, see our Risk:Reward, Expectancy, Win Rate guide. This article picks up where that one leaves off.
How Much Risk per Trade Can Your Account Actually Tolerate?
There’s no single correct answer here, and any article that gives you one number and calls it the answer is skipping the part that actually matters: your situation, your strategy’s own behavior, and how much drawdown you can genuinely sit through without abandoning a sound plan out of panic.
A more useful way to approach it is as a five-step process:
- Decide the drawdown you’re actually prepared to tolerate. Not the number that sounds disciplined on paper, but the number you could genuinely watch happen to your account without changing your plan out of fear.
- Consider the losing streaks that are plausible for your strategy. Your own win rate and trade history are the starting point here, not someone else’s.
- Stress-test those streaks at different risk-per-trade levels, using the table earlier in this article as a starting reference.
- Choose a risk level that leaves genuine margin, not one that only works if everything goes roughly to plan.
- Re-evaluate as your strategy’s real, observed behavior comes in. A risk% chosen from assumptions should be revisited once you have actual data to check it against.

You’ll see 0.25%, 0.5%, 1%, 2%, 3%, and 5% referenced across trading education fairly often, and different experienced traders land in different places within (and occasionally outside) that range. Several independent trading educators covered in our research use figures in the 1–3% range; at least one professional source in our research argues for a much smaller figure, closer to 0.25%, citing higher trade frequency and a lower personal tolerance for drawdown as the reasoning. Neither end of that range is a scientifically settled answer. They’re documented preferences, not a consensus, and the table above is the tool for deciding which one actually fits your own account and strategy rather than borrowing someone else’s number.
A Practical Example: Same Strategy, Different Risk per Trade
To make this concrete: imagine a $10,000 account and a single, identical stress-test scenario: ten consecutive losses, each one a full stop-loss hit. Nothing about the strategy changes between these four versions. The only thing that changes is risk per trade.
| Risk per trade | Ending capital | Drawdown | Recovery required |
|---|---|---|---|
| 0.5% | $9,511.10 | 4.89% | 5.14% |
| 1% | $9,043.82 | 9.56% | 10.57% |
| 2% | $8,170.73 | 18.29% | 22.39% |
| 5% | $5,987.37 | 40.13% | 67.02% |
This is a derived, mathematical stress-test illustration, not a claim that ten losses in a row are inevitable, or a prediction that this exact scenario will happen to any given account. What it does show, clearly, is that the same strategy, the same losing streak, and the same starting capital can leave you in dramatically different positions depending purely on how much you chose to risk per trade. At 0.5%, this streak is an inconvenience. At 5%, it’s a serious setback requiring a two-thirds recovery just to get back to even.
What This Means for MetaTrader Position Sizing
Everything above answers the "how much" question at the account level: what percentage of your capital should you actually be risking, given how it behaves across a realistic losing streak. Once you’ve settled on that number, it becomes the direct input into your position-sizing calculation: the risk percentage you plug in alongside your stop-loss distance to arrive at an actual lot size for each trade.
We’ve already covered that mechanical side in detail in Position Sizing and Risk per Trade, so we won’t repeat the formula here. The relationship between the two articles is simple: that guide shows you how to size one trade from a chosen risk%; this one is about choosing that risk% with your eyes open to what it actually does to your account over time.
How Trade Manager Helps Enforce a Risk Policy
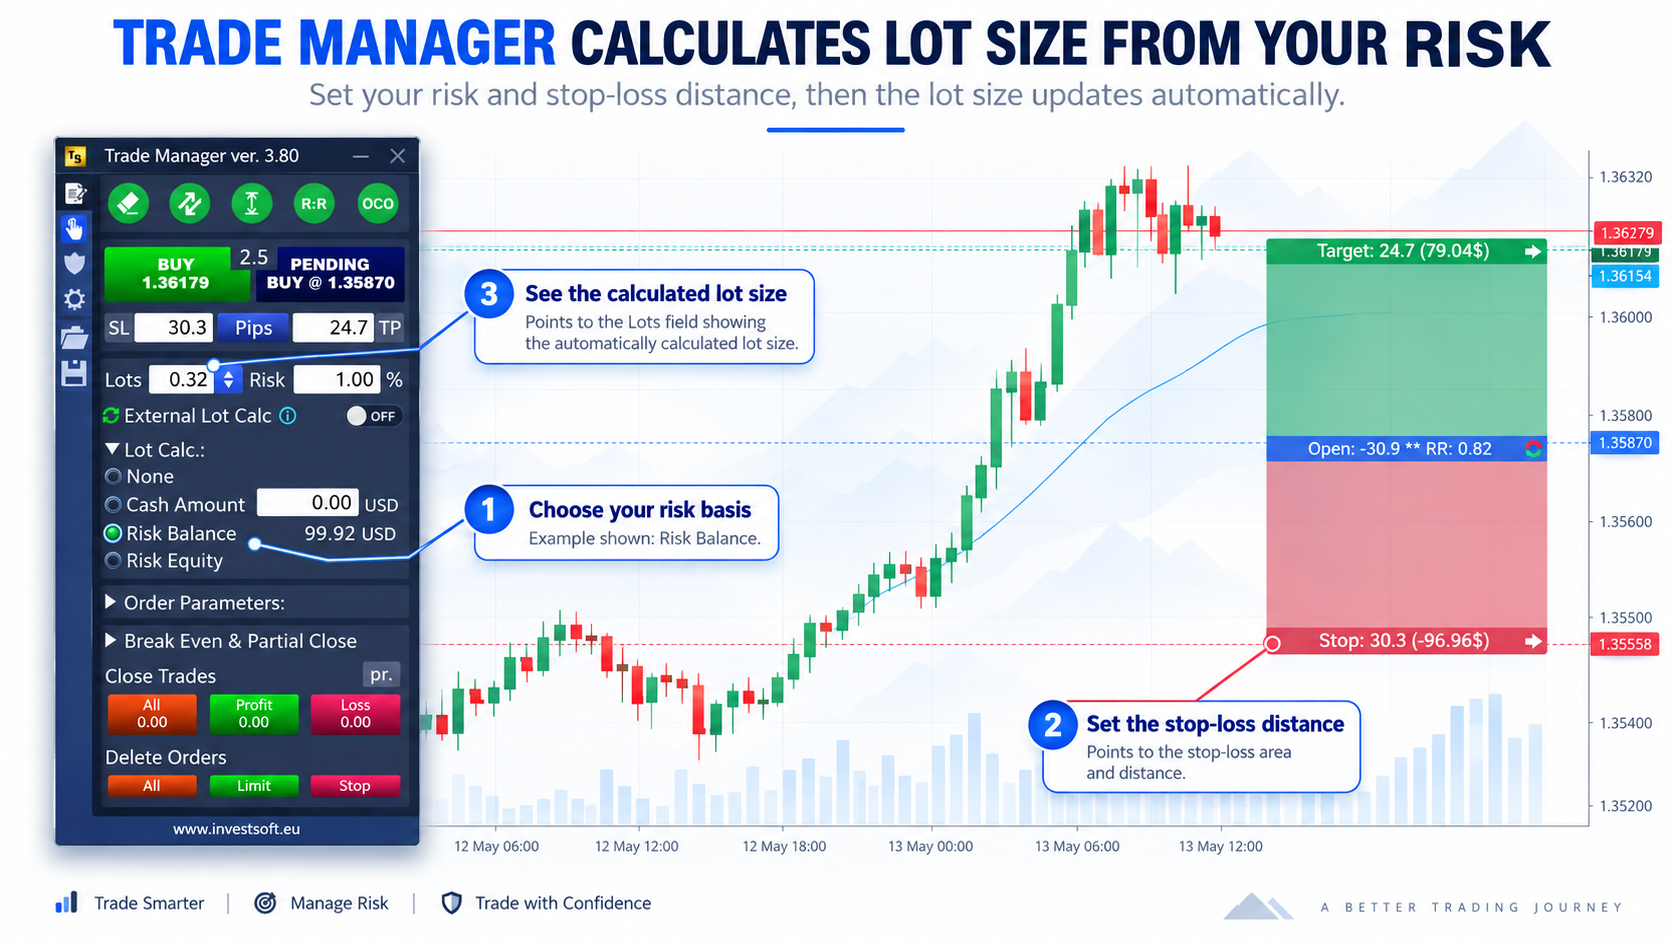
It helps to be clear about where a tool like Trade Manager fits into everything above, because the two things it does and doesn’t do are easy to blur together. Your risk policy, meaning the percentage you decide to risk per trade based on the drawdown math above, is a decision you make. Trade Manager’s role is to help you execute that decision consistently, trade after trade, without the drift and inconsistency that tends to creep in when position sizing is done by hand under pressure.
Concretely, Trade Manager for MT4 and MT5 calculates your position size automatically from whichever risk basis you choose: a fixed cash amount (Cash Amount), a percentage of your account balance (Risk Balance), or a percentage of your current equity (Risk Equity). That calculation updates live as you adjust your Stop Loss on the chart, so the lot size stays aligned with your chosen risk% rather than requiring a manual recalculation every time your stop moves. It also includes a configurable maximum-acceptable-risk warning that visually flags a trade if it exceeds the risk ceiling you’ve set. It’s a useful check against sizing errors, though it’s a warning, not something that blocks the trade outright. For traders who want to enforce a hard stopping point once they’ve calculated one for themselves, Equity Control can be configured to automatically close managed positions after a defined loss limit or equity level is reached.
What Trade Manager does not do is any of the calculation this article has walked through. It doesn’t predict losing streaks, forecast drawdown, estimate risk of ruin, or run any kind of simulation on your behalf. It doesn’t improve your expectancy or your win rate, and it can’t prevent a loss from happening. Those are all things you work out for yourself, using the kind of thinking this article lays out. Trade Manager’s job starts once you’ve already decided what your risk policy actually is.
Why Prop Firm Accounts Need a Different Risk Budget
One thing worth flagging briefly, especially if you’re trading a funded or evaluation account: the account size a prop firm advertises is not the same thing as your real, usable risk budget.
A firm’s nominal account size (say, a "$50,000 account") is the nominal trading allocation the firm gives you access to, and that figure doesn’t behave identically across every funded-account structure. In most cases, it’s not the amount of drawdown you’re actually allowed before the account fails. Daily loss limits, maximum overall drawdown rules, and trailing drawdown structures all sit underneath that headline number, and depending on how they’re set, they can shrink your genuinely usable risk budget to a small fraction of the nominal figure. A trader who sizes positions off the $50,000 headline, without accounting for how much smaller the real drawdown allowance is, can end up taking on far more risk relative to their actual budget than the account size suggests.
This deserves a dedicated, full treatment on its own: how to work out your real risk budget under a specific set of prop-firm rules, and how that changes your position sizing compared to a personal account. We’ll cover that in a future article, Prop Firm Challenge Risk Management: How to Calculate Your Real Risk Budget. For now, the takeaway is simply this: if you’re trading a funded account, don’t assume the nominal size is the number the math in this article should be run against.
Common Mistakes
A few patterns worth watching for, all of them direct consequences of the mechanics covered above:
- Assuming losses just add up. Percentage losses compound against a shrinking balance. They don’t simply stack on top of each other the way flat-dollar bets would.
- Assuming a high win rate rules out losing streaks. It doesn’t. It lowers their probability; it doesn’t eliminate them.
- Increasing risk after a loss to "make it back faster." This directly worsens the compounding math above. It takes an already-damaged account and exposes it to even bigger percentage hits at exactly the wrong moment.
- Choosing risk per trade without ever asking what a losing streak would do to the total account. Risk per trade in isolation tells you very little; risk per trade run through a realistic streak tells you a great deal.
- Treating positive expectancy as short-term safety. A positive edge is a long-run statement. It doesn’t protect any particular stretch of trades from looking rough.
- Trusting a single risk-of-ruin calculator’s output without understanding what it assumes. Different models, different assumptions, different numbers. Know which one you’re looking at.
- Changing your risk% based on how confident you feel rather than a defined policy. Confidence is not a risk-management input; it’s usually the thing risk management exists to protect you from.
Practical Drawdown and Risk Checklist
- Know your current risk per trade, precisely, not roughly.
- Define, in advance, the maximum drawdown you’re genuinely prepared to experience.
- Stress-test a realistic losing streak for your strategy against the table earlier in this article.
- Calculate the compounded drawdown that streak would produce at your current risk%.
- Check the recovery percentage that drawdown would require.
- Leave real margin for variance. Don’t size right up to the edge of what you can tolerate.
- Size every trade consistently, using the same risk basis every time.
- Re-evaluate your risk% as actual trading data comes in, not just assumptions.
Frequently Asked Questions
Can a profitable trading strategy still have a losing streak?
Yes. Positive expectancy describes the average result across repeated trades, not the order in which wins and losses arrive. A profitable strategy can still experience several losses in a row and a meaningful drawdown.
Why can several losing trades create less drawdown than simply multiplying risk% by the number of losses?
Because risk is calculated as a fixed percentage of the remaining account balance, not the original balance. Each successive loss is applied to a slightly smaller capital base, so N × Risk% is only an additive shortcut. The exact fixed-fractional relationship is Drawdown% = 1 − (1 − Risk%)^N.
Is there one formula for risk of ruin in trading?
No. No single universal formula is appropriate for every trading situation. Different models make different assumptions about position sizing, win/loss behavior, payoff structure, capital thresholds, and whether the calculation is simulation-based or parametric, which is why different risk-of-ruin calculators can return different outputs for what looks like the same inputs.
How much should you risk per trade?
There’s no single correct percentage. Define the drawdown you’re willing to tolerate, consider the losing streaks plausible for your strategy, stress-test those streaks at different risk levels, choose a risk level with sufficient margin, and re-evaluate as your strategy’s real, observed behavior comes in.
Final Takeaway
Risk per trade doesn’t determine whether your strategy has an edge. That’s a separate question, answered by your win rate, your average winner and loser, and your expectancy. What risk per trade determines is how much damage a normal, entirely expected adverse sequence can do to your account while that edge plays out over time.
The goal was never to eliminate losing streaks. They’re part of trading, not a failure of it. The goal is to size your risk small enough that when a losing streak arrives, your account is still standing on the other side of it, ready to keep trading the edge your data supports.
