Risk-to-Reward Ratio vs. Win Rate: Why Expectancy Decides Profitability
Categories Risk Management
Two pieces of advice come up constantly in retail trading. One says you should aim for a high risk-to-reward ratio: “never take a trade unless the reward is at least twice the risk.” The other says you should aim for a high win rate: “if my system isn’t winning most of the time, it isn’t working.”
Both sound reasonable. Neither tells the whole story.
A risk-to-reward ratio compares how much you are risking on a trade with how much you could make if the trade reaches its target. Throughout this article, the ratio is written risk first. A 1:2 ratio means risking 1R to potentially make 2R. Here, 1R is simply the amount you decided to risk on that trade.
The ratio alone does not tell you whether a system makes money. Win rate alone does not tell you either.
A system with a 1:10 ratio can still have negative expectancy if it wins too rarely. At the same time, a system that loses more often than it wins can still have positive expectancy if its winners are large enough.
What matters is how win rate and the size of wins and losses work together. Expectancy puts that relationship into one number.
Once you understand it, the question becomes much more useful than “is my R:R good enough?” You can ask: does my win rate clear the minimum my system actually needs?
What Is Trading Expectancy?
Expectancy answers a practical question: if you repeat the same trading approach over many trades, what is the average result per trade?
To answer that, you need to know two things: how often you win, and how large your average winner is compared with your average loser.
A system that wins 80% of the time can still lose money if the occasional losses are much larger than the frequent wins. A system that wins only 30% of the time can still perform well if its winners are large enough.
So a high win rate does not guarantee profitability, and a low win rate does not automatically mean a losing system.
The standard formula is:
Expectancy = (Win Rate × Average Win) − (Loss Rate × Average Loss)
Win rate is the share of trades that finish as winners. Loss rate is the share that finish as losers. Average Win tells you how much the typical winning trade makes, while Average Loss tells you how much the typical losing trade gives back.
You can measure the averages in money, but R-multiples are usually more useful when you want to compare systems or account sizes. If 1R is the amount risked on one trade, then an expectancy of +0.30R means the strategy produces an average of 0.30 times the initial risk per trade before costs.
There is one important distinction here.
The risk-to-reward ratio you plan before entering a trade is not necessarily the same as the average win and average loss you eventually realize.
Your planned R:R comes from the initial stop-loss and take-profit. Your realized results come from what actually happened after the trade was opened.
Partial exits, moving a stop to break even, trailing stops, closing early, or slippage can all change the final size of a winner or loser. For that reason, the examples below use the planned ratio as a simple stand-in for realized results. In your own trading, expectancy should ultimately be calculated from closed trades.
A worked example makes this easier to see.
Take a system with a 55% win rate and a 1:1.5 risk-to-reward ratio, with 1% of account balance risked per trade. In this simplified example, a winner makes 1.5R and a loser loses 1R:
Expectancy = (0.55 × 1.5R) − (0.45 × 1R) = 0.825R − 0.45R = +0.375R per trade
Keeping that result in R makes it easy to compare across different account sizes.
On a $10,000 account risking 1% per trade, 1R equals $100. At that balance, +0.375R is roughly +$37.50 per trade on average.
That does not mean every trade makes $37.50. Individual trades will still finish as winners and losers. Expectancy describes the average result across a sufficiently large sample.
The dollar value also changes as the account balance changes. If you continue risking a fixed percentage of the account, the cash value of 1R moves with the balance even though the expectancy in R stays the same.
Trading costs matter as well. The simplified expectancy formula usually leaves out spread, commission and slippage. Some educational examples say that clearly, while others do not.
So +0.375R is not a guaranteed net result. It is the theoretical starting point before those real-world costs are taken into account.
Trade Manager does not calculate expectancy. There is no built-in expectancy tool.
What it can help with is the planning side. Your stop-loss and take-profit define the planned risk-to-reward ratio before the trade is opened. After that, partial exits, break-even stops, trailing stops and manual decisions can change the result you actually realize.
That is why your real Average Win and Average Loss still have to come from your closed-trade history. Win rate and expectancy also need to be tracked separately.
A High Risk-to-Reward Ratio Doesn’t Guarantee Profit
A favorable R:R looks attractive on its own, but expectancy shows why that can be misleading.
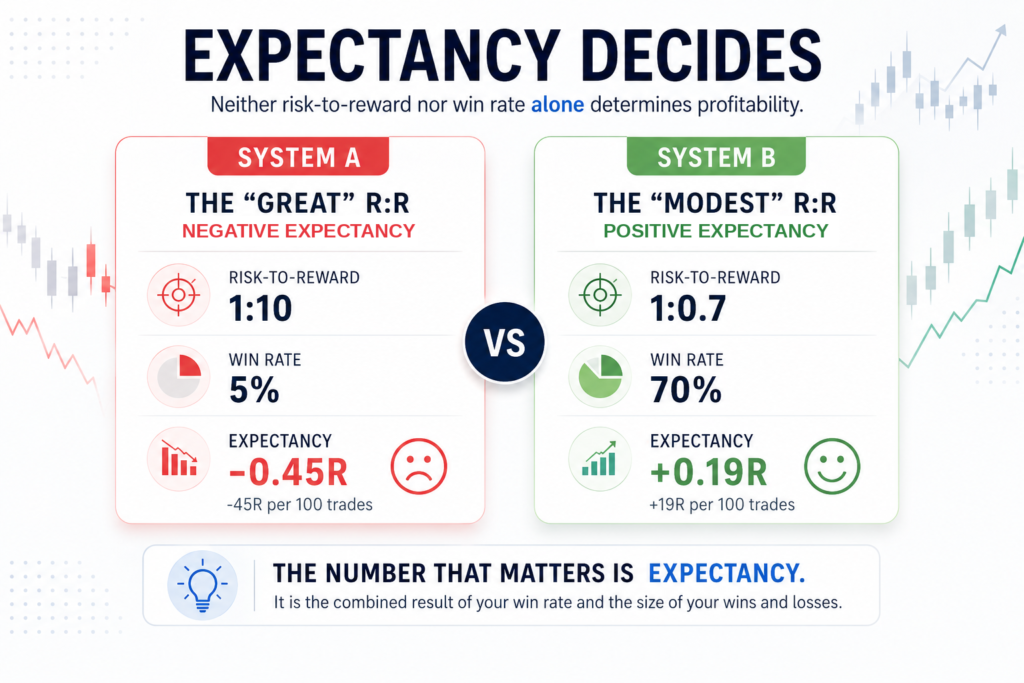
Rayner Teo uses a simple example. Imagine a system with a 1:10 ratio. You risk 1R to potentially make 10R, but the system wins only 5% of the time:
Expectancy = (0.05 × 10R) − (0.95 × 1R) = 0.5R − 0.95R = −0.45R per trade
Across 100 trades, that works out to roughly −45R before costs.
The payoff is large, but the wins are too rare to compensate for all the losing trades.
Now look at the opposite case.
A system risks 1R to make only 0.7R, so its risk-to-reward ratio is 1:0.7. Many traders would immediately call that a poor ratio. But if the system wins 70% of the time:
Expectancy = (0.70 × 0.7R) − (0.30 × 1R) = 0.49R − 0.3R = +0.19R per trade
Across 100 trades, that is roughly +19R before costs.
The first system has an impressive-looking R:R and negative expectancy. The second has a modest R:R and positive expectancy.
This is why rules such as “always trade at least 1:2” or “only take 1:3 setups” are not enough on their own. Nick Radge makes the same point in simple terms: over time, the total value of your winners has to outweigh the total value of your losers.
A higher win rate is not automatically better than a higher R:R, and a higher R:R is not automatically better than a higher win rate. You have to look at the combination.
Why R:R and Win Rate Tend to Move Together
Risk-to-reward ratio and win rate are not always two completely independent settings that you can adjust without affecting anything else.
One trading educator gives a plausible explanation. If you move the take-profit farther away, the potential reward increases, but price also has farther to travel before the trade becomes a winner. If you tighten the stop, the ratio may look better on paper, but the stop can also become easier to hit.
In practice, that can create a trade-off. Trying to push R:R higher may put downward pressure on win rate, while accepting a smaller reward target may increase the percentage of trades that reach it.
This should not be treated as a universal mathematical law. In the research for this article, the explanation comes from a single source. There is no independently confirmed rule saying that a specific change in stop distance or target distance will produce a specific change in win rate.
It is better to treat this as a useful mechanism to think about, not as something you can calculate in advance.
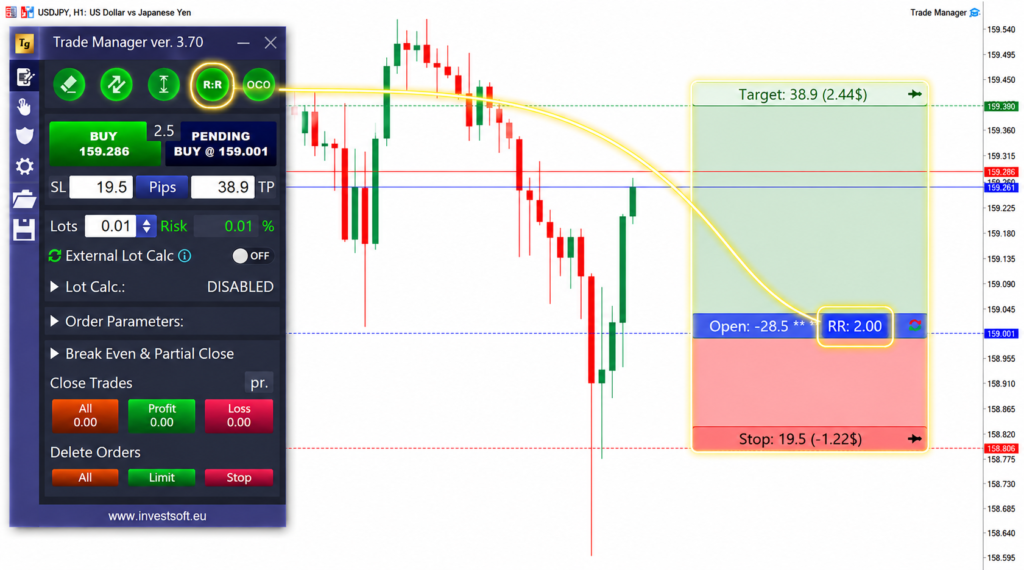
Trade Manager’s Fixed Risk Reward Ratio feature can help once you have chosen a target ratio. As you adjust the stop-loss or take-profit during trade planning, the other level can remain linked to the ratio you selected.
The feature does not tell you whether that ratio makes sense for your actual win rate. You still need your own trading results to answer that question.
There is no single R:R that is “good” in isolation. The ratio only becomes useful when you compare it with the win rate required to support it.
That brings us to break-even win rate.
The Break-Even Win Rate: Your System’s Minimum Bar
Generic targets such as “you need a 60% win rate” or “never trade below 1:2” ignore the relationship between the two numbers.
Every risk-to-reward ratio has its own break-even win rate. This is the minimum percentage of winning trades needed for the math to balance before trading costs.
The formula is:
Break-even Win Rate = Average Loss / (Average Win + Average Loss)
If the average loss is normalized to 1R, you can write the same idea more simply as:
Break-even Win Rate = 1 / (1 + reward-to-risk)
For a 1:2 risk-to-reward ratio, the reward-to-risk value is 2. For a 1:0.5 ratio, it is 0.5.
Here are a few common examples:
| Risk-to-Reward Ratio | Break-Even Win Rate |
|---|---|
| 1:3 | 25.0% |
| 1:2 | 33.3% |
| 1:1 | 50.0% |
| 1:0.5 | 66.7% |
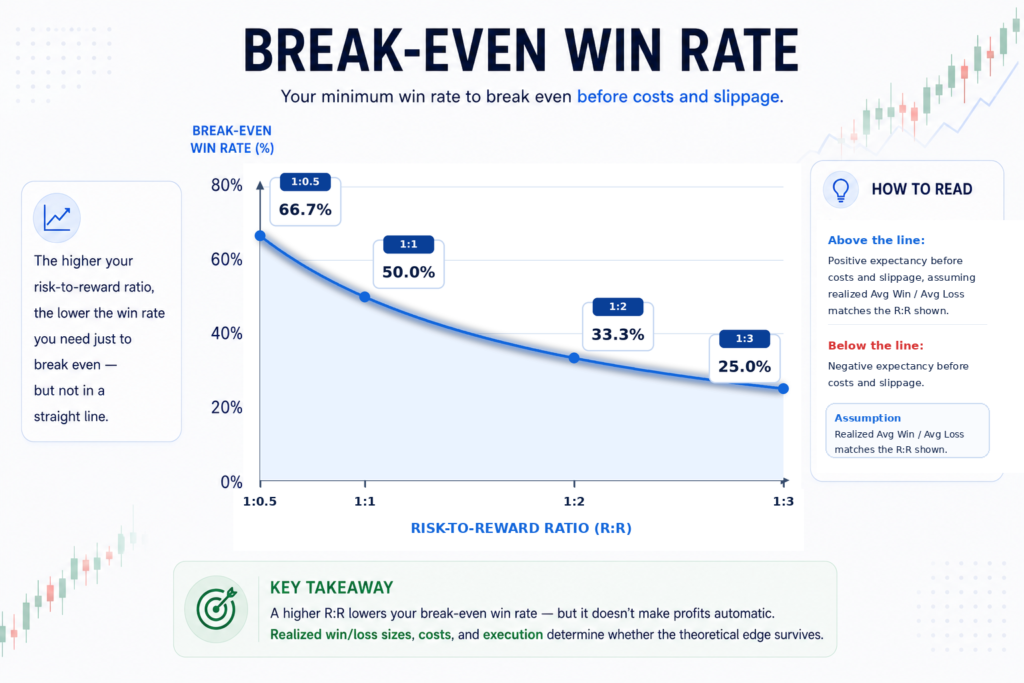
A 1:2 system only needs to win about one trade in three to break even. A 1:1 system needs to win half of its trades. A 1:0.5 system needs to win roughly two out of three.
This is a much better way to judge a ratio than asking whether it simply “sounds good.” First work out the break-even win rate, then compare it with the results your system actually produces.
There are two important caveats.
First, the calculation only works as shown if your realized average winner and average loser match the ratio you are using.
A system planned at 1:2 has a 33.3% break-even win rate only if the average winner you actually realize is about twice the size of the average loser. If partial exits, break-even stops, slippage or early closes change those averages, the true break-even point changes too.
Second, the basic calculation does not include spread, commission or slippage. A system that sits exactly at theoretical break-even is still likely to lose money after costs.
The 1:1 case is a useful example of why checking the math matters.
In one video, a well-known trading coach says that a trader using a 1:1 setup needs a 55% or 60% win rate to have a real chance of being profitable.
That is not the mathematical break-even point.
At 1:1, the exact break-even win rate before costs is 50%. Interestingly, the same speaker had already implied that threshold earlier in the video by saying that a trader stuck at 49% would be losing money.
The lesson is not that experienced traders have nothing useful to say. It is that simple trading math is worth checking for yourself, especially when a round number is presented as a rule.
Trade Manager does not calculate or track break-even win rate. It also does not provide built-in win-rate tracking or R-multiple journaling.
To compare your results with the break-even threshold, you still need data from your own trade history.
Why the Margin Above Break-Even Matters
Reaching break-even is only the first hurdle.
A system that sits exactly on its theoretical break-even win rate is flat before costs. Once spread, commission and slippage are included, the result moves below zero.
It is also useful to look beyond the number of percentage points between your actual win rate and break-even. Two systems can have a similar win-rate cushion and still have different expectancy in R.
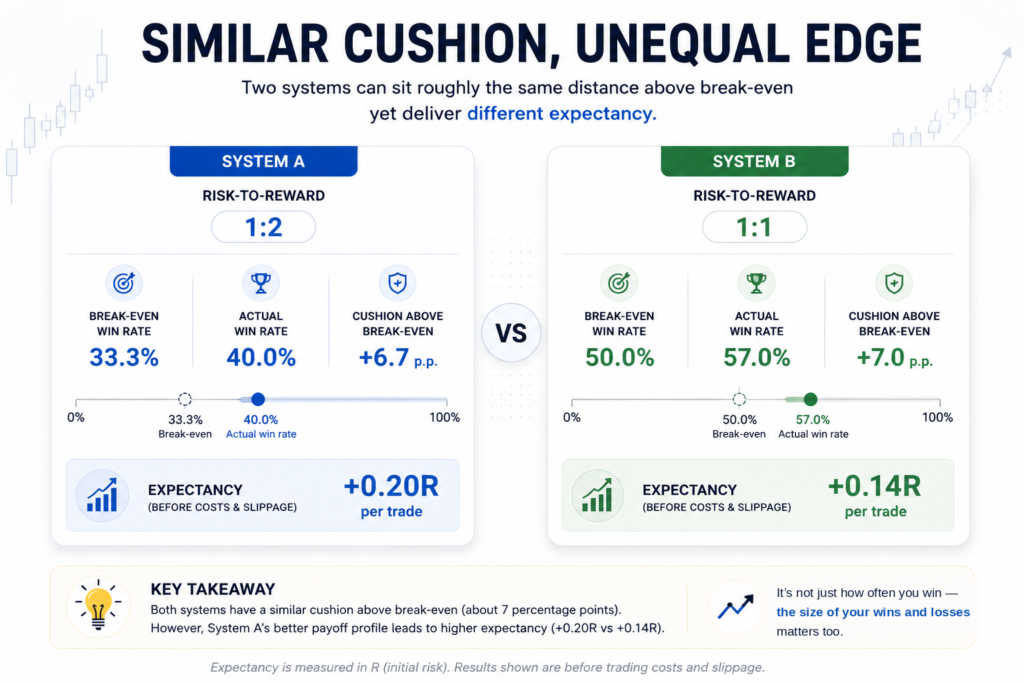
For example, a 1:2 system winning 40% of the time is 6.7 percentage points above its 33.3% break-even rate. Its expectancy is +0.20R per trade.
A 1:1 system winning 57% of the time is 7.0 percentage points above its 50% break-even rate. Its expectancy is +0.14R per trade.
The win-rate cushions are almost the same, but the expectancy is not. That is why the distance above break-even, measured only in percentage points, does not tell the full story.
This matters because a system with barely positive expectancy has less room for error than one with a larger edge.
Small execution habits can eat into that margin. Cutting winners short, allowing losers to run beyond the planned stop, or repeatedly giving up a few tenths of R through execution can pull live results below the numbers you saw in a backtest or spreadsheet.
A system with more expectancy in R has more room to absorb that friction. A system sitting close to zero has very little.
That is a practical judgment rather than a universal measured threshold, but it explains why “positive” and “comfortably positive” are not the same thing.
Once a trade is open, Trade Manager’s Break Even and Trailing Stop features can help make parts of trade management more consistent. Both can be defined in R-multiples, so stop adjustments can follow rules set in advance instead of being decided manually in the middle of a trade.
That is a separate topic from choosing the initial R:R and evaluating win rate, so it only needs a brief mention here.
What This Means for Your Trading
A high R:R is not a trading edge by itself. Neither is a high win rate.
A better process is to look at your realized average win, your realized average loss and your win rate together.
From there, ask three questions:
- What is my expectancy per trade?
- What win rate do my realized wins and losses require just to break even?
- How much room do I have above that level after normal trading costs and execution are taken into account?
Trade Manager can help with the planning and management side of this process. It can keep a fixed ratio during trade setup and automate actions such as partial closes, break-even moves and trailing stops.
It does not calculate your win rate or expectancy, and it does not tell you how large a sample you need before you can trust those numbers. The question of sample size is genuinely debated and does not have one simple answer that fits every trading system.
That leaves one part of the process firmly with the trader: track what actually happens in your closed trades, then compare those results with the break-even level your realized winners and losers require.
That is the comparison that tells you whether the system has positive expectancy.
